
After completing the post-curriculum assessments, we can generate educator-level reports, allowing you to track overall student improvement in your classroom.
Once you receive the results, the following information will help you understand the data.
Page 1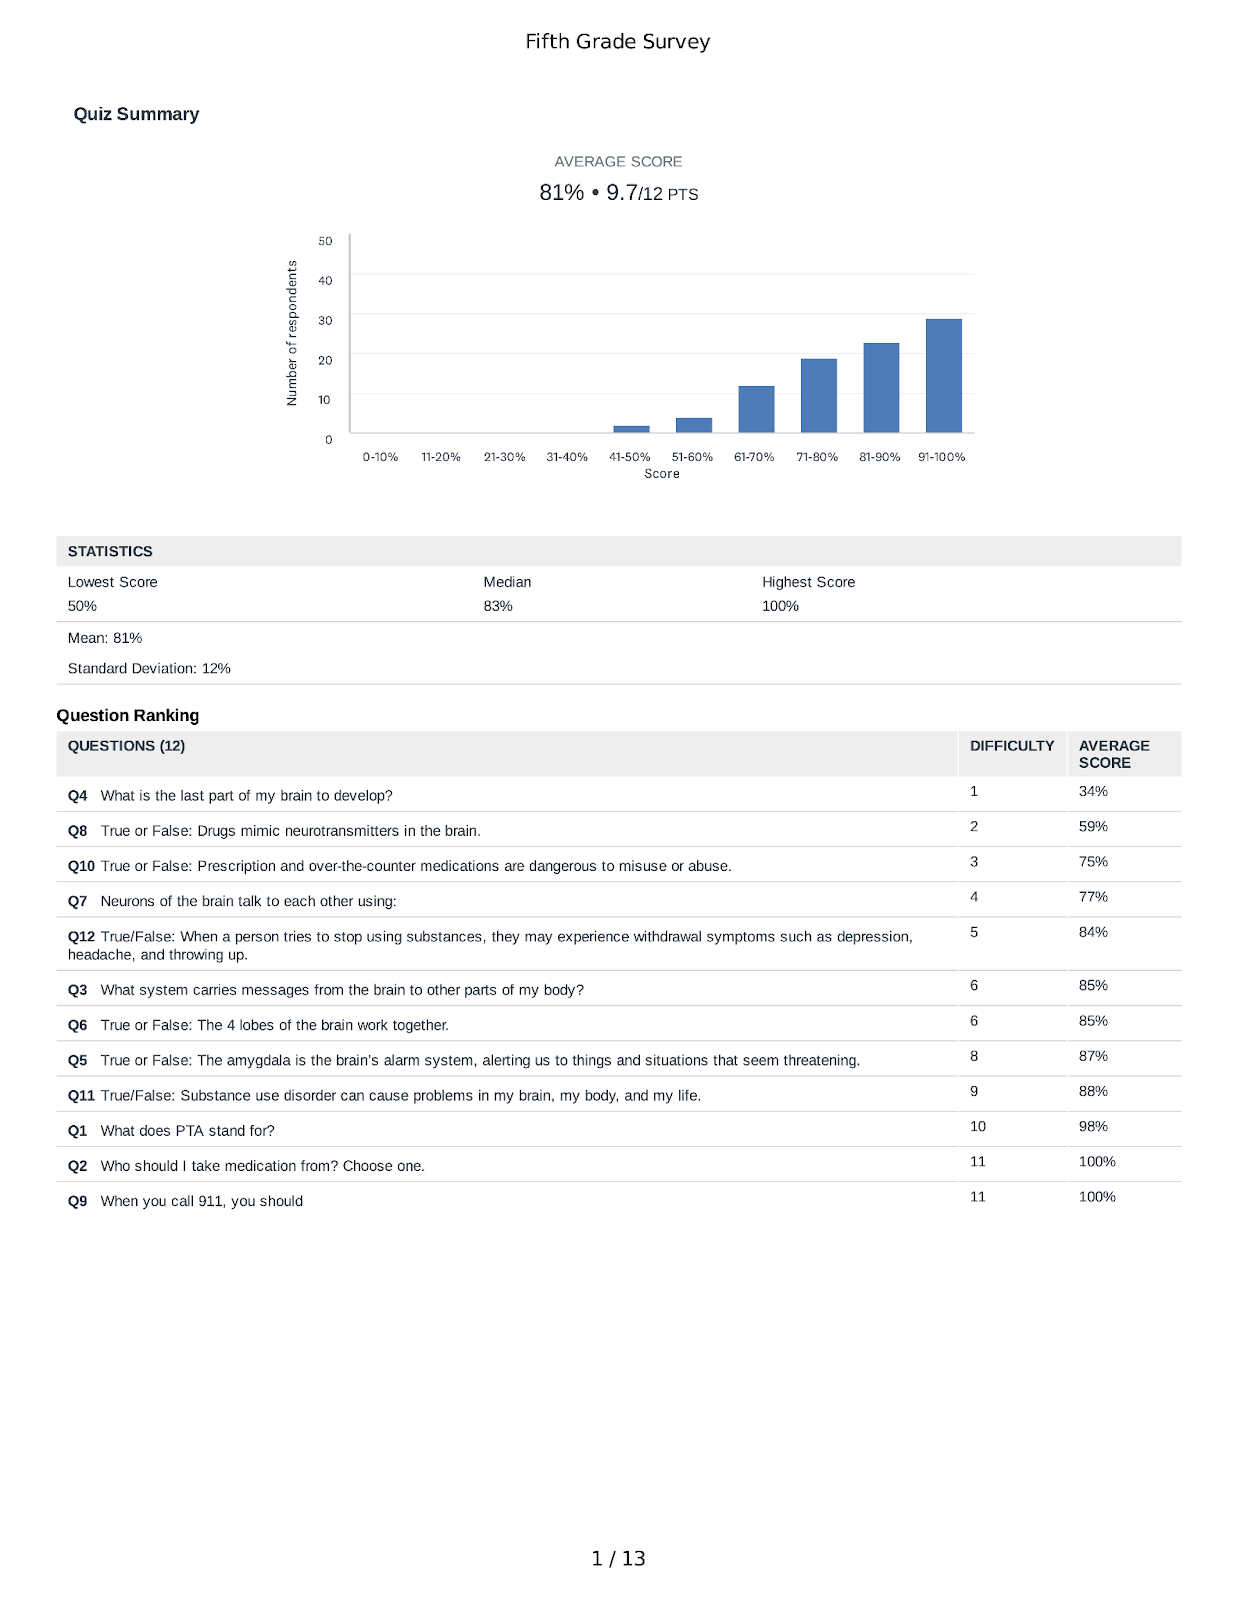
This page shows the combined results of pre- and post-curriculum assessments.
We recommend viewing each survey question on the following pages to see actual improvements.
 Question Pages
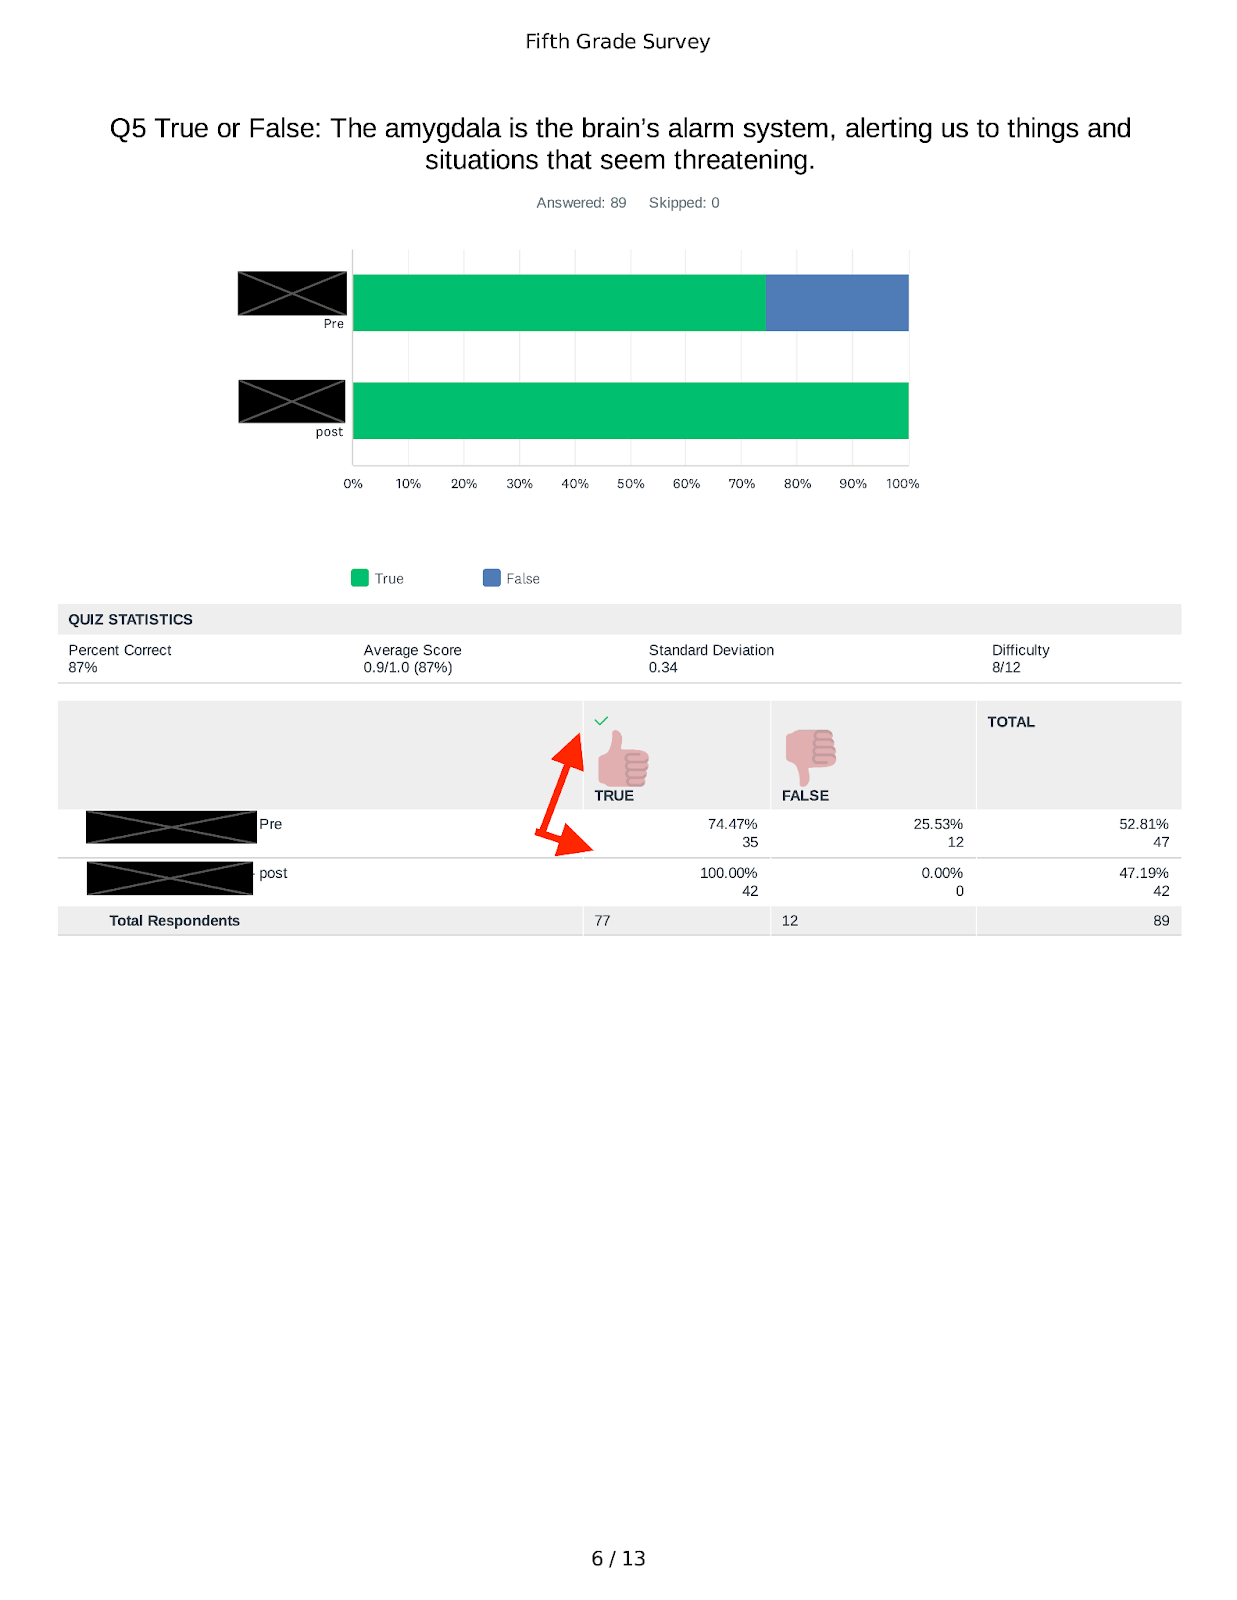
Each page shows the results of each individual question.
In the chart, the top bar is the pre-assessment results, and the bottom bar is the post-assessment results.
Looking at the table, the best way to see improvement is by looking at the column with the green checkmark. This represents the correct answer.
In the example to the left, 74% of students answered the question correctly in the pre-assessment, and 100% answered it correctly in the post-assessment.
Comments
0 comments
Article is closed for comments.